Visualizing what heat does to a protein, without running molecular dynamics
The hardest chapter in heat-protein-lab is Chapter 4. It is the chapter where a real human enzyme falls apart on the page as the reader scrolls. It is also the chapter most likely to mislead — the one most adjacent to the line where “educational visualization” becomes “fake science.” This post is about how I drew that line in the code, where the line shows up in the UI, and why I think the chapter is more honest than a fully animated molecular-dynamics simulation would have been.
The chapter is live at heat-protein-lab.pages.dev/#chapter-4. It opens with a red badge above the heading that reads VISUALIZATION, NOT MOLECULAR DYNAMICS. The badge sits inside the chapter shell, not the page chrome, so it cannot scroll out of view while the chapter is in the viewport. That placement is the load-bearing UX decision in the chapter.
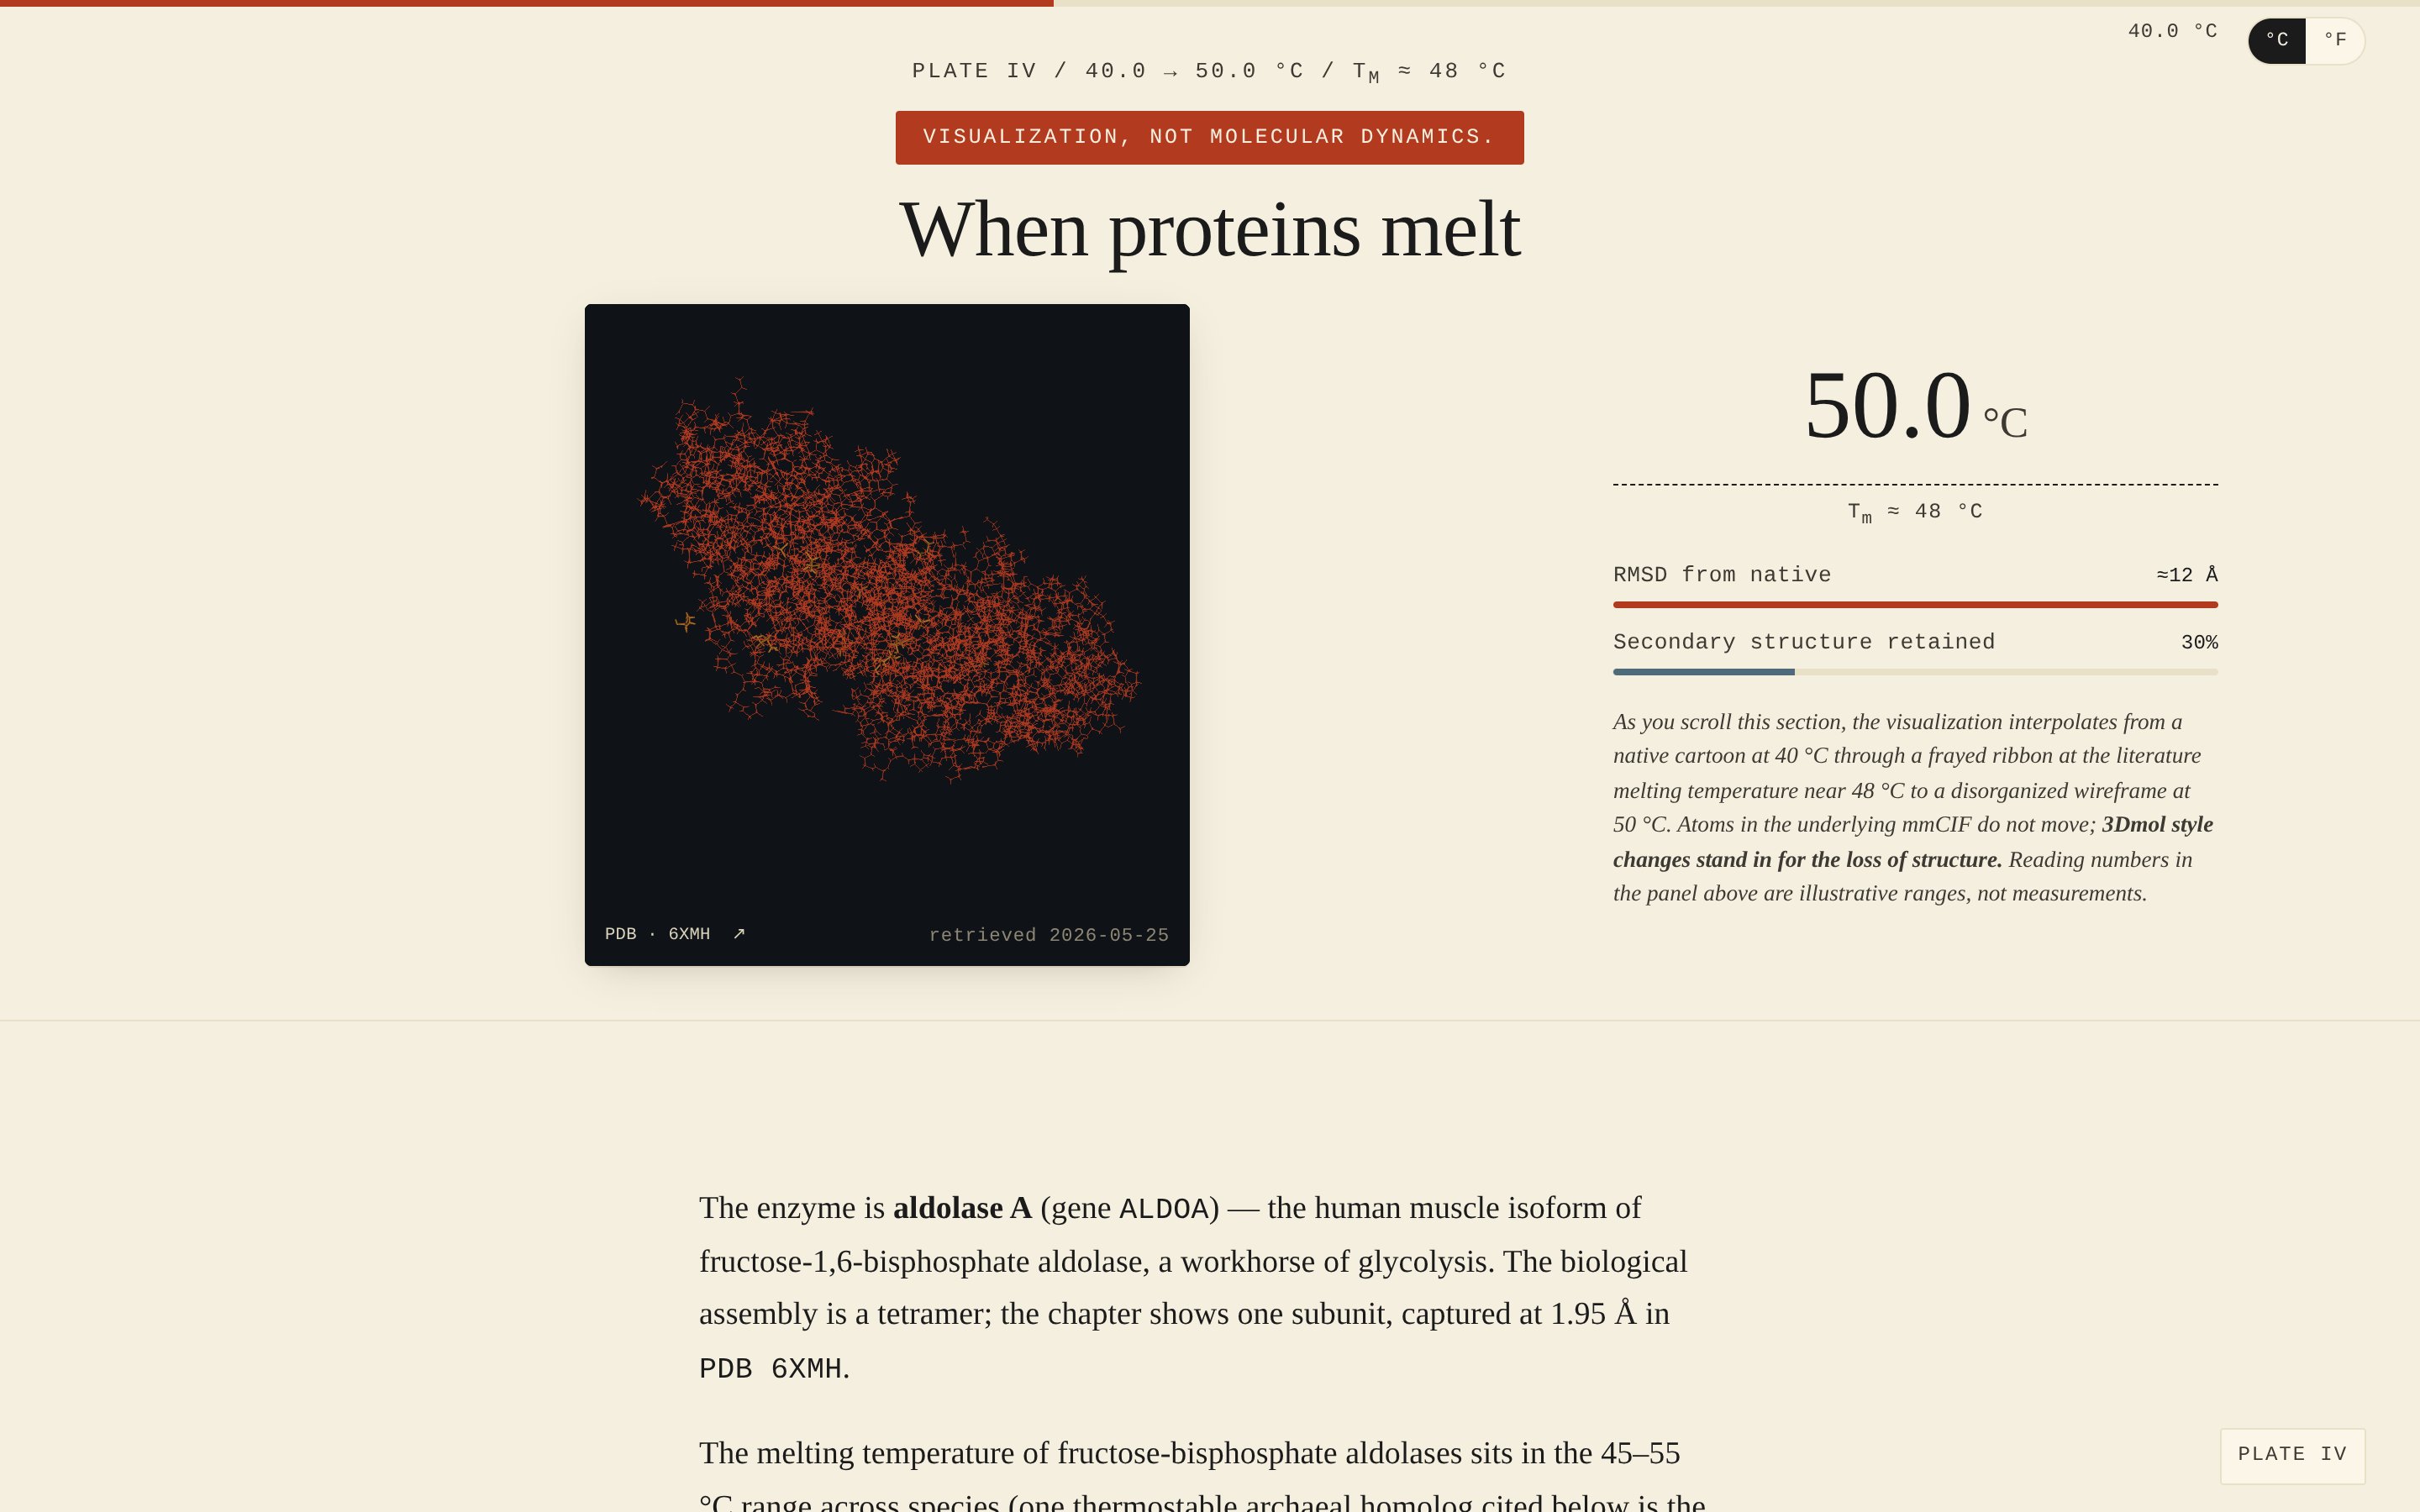 Chapter 4 at the end of the scroll. The disclaimer above the heading reads “VISUALIZATION, NOT MOLECULAR DYNAMICS.” The readout panel on the right shows quantities that are deliberately fuzzy — “≈12 Å”, “30%” — to make it visually obvious these are illustrative ranges, not measurements from a simulation.
The protein, and why this protein
The enzyme is aldolase A (gene ALDOA), the human muscle isoform of
fructose-1,6-bisphosphate aldolase. It is a workhorse of glycolysis,
splitting fructose-1,6-bisphosphate into two three-carbon
intermediates. Every cell that runs glycolysis runs aldolase. The
biological assembly is a homotetramer; the chapter renders one
subunit at 1.95 Å resolution from PDB 6XMH.
The reason aldolase A landed in this chapter and not, say, HSP70 or HSF1, is purely about thermal range. The melting temperature of fructose-bisphosphate aldolases sits in the 45–55 °C range across species in the literature, and the human enzyme in particular has been characterized around 48 °C. That window is exactly the window the page wants to walk the reader through — from 40 °C (hyperthermia), past 41–42 °C (medical emergency in vivo), and into the temperature range where a real human enzyme starts to fail. If I had picked a hyperstable protein like a thermostable archaeal homolog, the visualization would have shown the protein looking fine at 50 °C, which would have been technically true and narratively useless. Aldolase A sits at the edge where the body’s own enzymes go.
The chapter copy also notes the relationship between cellular temperature and core body temperature. Aldolase A’s T_m is well above human core temperature even in extreme hyperthermia (42 °C is “medical emergency in vivo” but is still six Celsius degrees below the literature T_m). The chapter is therefore explicit that what is being visualized is the chemistry of the molecule under heat, not a state your cells will reach. That distinction matters for not making medical claims.
What the visualization actually does
The 3Dmol viewer holds one mmCIF file: data/structures/pdb/aldolase/pdb_00006xmh.cif.gz,
about 200 KB gzipped. The viewer is mounted once on chapter entry
and is never re-mounted. The atoms in the structure file never
move. Nothing about the rendered geometry changes during the
scroll. What changes is the 3Dmol style applied to those atoms.
There are three discrete stages:
| Stage | Scroll fraction | Style | Color |
|---|---|---|---|
| Native | 0.00 – 0.34 | cartoon (alpha-helix and beta-sheet ribbons) | slate #4f6b7a |
| Stressed | 0.34 – 0.67 | thin ribbon (a single tube through the backbone) | warm yellow #b8a04f |
| Denatured | 0.67 – 1.00 | line / wireframe (every bond drawn explicitly) | terra-cotta #b23a1f |
The three stages are picked to read at a glance: the eye distinguishes “ordered cartoon,” “fraying ribbon,” and “scattered wireframe” without needing to interpret atomic positions. The denatured stage isn’t claiming the protein has unfolded into a specific conformation; it is claiming the protein no longer has structure, full stop, by removing every drawing convention that implies structure.
Color does narrative work too. Slate at 40 °C reads as cool /
healthy / ordered. Yellow at 45 °C is the transition warning. Terra
cotta at 50 °C is the alarm. These three colors map onto the page’s
heat ramp: --heat-40 → --heat-44. A reader who has scrolled
through Plates I through III has already trained on this palette.
The scroll math is intentionally boring:
const rect = els.ch4Section.getBoundingClientRect();
const viewportH = window.innerHeight;
const total = rect.height - viewportH;
let frac = (0 - rect.top) / total;
frac = Math.max(0, Math.min(1, frac));
frac is clamped to [0, 1] as the chapter section moves through
the viewport. The section is min-height: 250vh so the reader has
real estate to scroll through. The driver is requestAnimationFrame
-throttled and short-circuits if the fraction has not changed by
more than 0.005 since the last frame — that keeps the scroll thread
cheap on lower-end devices.
The readout panel on the right of the viewer is a separate set of numbers driven by the same fraction:
- Temperature: a linear interpolation between 40.0 °C (frac=0) and 50.0 °C (frac=1).
- RMSD from native: scales from 0 Å to ≈12 Å. The bar color shifts from slate to terra-cotta. The “≈12 Å” upper bound is a literature-plausible value for partly-unfolded globular enzymes, but the number is illustrative — the page says so in italics in the figure caption.
- Secondary structure retained: drops from 100 % to 30 %. Same framing.
Every quantity that updates is wrapped in aria-live="polite" so a
screen reader announces the changes as the chapter is scrolled.
What the visualization deliberately does not do
There is no molecular-dynamics simulation behind the chapter. I do not have a GROMACS run, I do not have NAMD, I do not have AMBER. The 3D model is one frozen crystallographic snapshot with its drawing style swapped out at three scroll positions. If I had run a short MD trajectory and rendered the actual atomic motions across temperature, that would have been a different kind of project — and a much riskier one, because every visible motion would imply a specific claim about the protein’s behavior under heat, and any of those claims could be wrong.
The atoms not moving is the chapter’s most important honesty signal. Once you notice the same protein stays in the same orientation across all three stages, the chapter stops feeling like a miniature simulation and starts feeling like what it is — a reading aid for the concept of denaturation. The wireframe at 50 °C is not where this protein actually ends up at 50 °C in any real solvent system. It is the visual answer to the question “what does it look like when we stop letting ourselves draw the structure as if it has structure.”
The reduced-motion fallback is also worth flagging. Readers who
declare prefers-reduced-motion: reduce skip the scroll driver
entirely; the chapter snaps to the denatured end state on first
paint and the readout fills in 50.0 °C, ≈12 Å, 30 %. They see what
the chapter is about without the animated transition, which is
the right behavior for anyone whose body or browser has told them
the page should be quiet.
The chapter’s third visual: the styled cartoon → ribbon → wireframe sequence
The thing I am most proud of in the chapter is how cheaply the three stages compose visually. 3Dmol’s style API takes a single object per style call:
viewer.setStyle({ cartoon: { color: "#4f6b7a" } });
// then
viewer.setStyle({ cartoon: { color: "#b8a04f", thickness: 0.3 } });
// then
viewer.setStyle({ line: { color: "#b23a1f" } });
That last call is the one that does the most work narratively. By the time the reader has scrolled to it, every 3Dmol style cue they have learned in the previous three chapters has just been removed. There is no cartoon. There is no surface. There is no implied secondary structure. There is just a thicket of lines that happens to outline the shape of a molecule. The visualization is not telling you what the protein looks like — it is showing you the absence of the conventions that tell you what a protein looks like.
It is the same compositional move as a black-and-white photograph of an exploded mechanical watch laid out on a table. The watch is all there. None of it is doing anything. You read the implication.
Why the chapter is the centerpiece
Chapters 1, 2, and 3 introduce three proteins as protagonists. Chapter 4 is the one where the reader is asked to feel the cost of failure for those protagonists. The chaperones (HSP70, HSP90) exist to prevent this picture. HSF1’s job is to make sure the cellular machinery is ready when this picture starts to compose itself. Chapter 4 is what they are working against. The page is unread without it.
It is also the chapter that most clearly stress-tests the project’s guardrails:
- No clinical claims. The readout numbers are framed as illustrative ranges with explicit fuzziness markers (≈, %).
- No physical simulation. Stated outright above the heading. Reinforced in the figure caption. Reinforced again in the body copy at the close of the chapter.
- No MD output checked into the repo. No simulated trajectories. Just one mmCIF crystallographic snapshot.
Every other chapter inherits these guardrails. Chapter 4 is where they are loudest — and that loudness is the point. A reader encountering this chapter without the disclaimer would, reasonably, read it as “this is what your aldolase looks like at 42 °C.” The disclaimer + the readout fuzziness + the no-MD framing add up to “this is the idea of what a protein looks like as it falls apart, dramatized at a temperature range above what your cells actually experience.”
What I’d do differently if I had a real MD setup
If I had a working MD pipeline, the next iteration of this chapter
would still not animate atom positions. It would do something
narrower and more useful: replace the “RMSD bar” placeholder
quantity with an actual RMSD trajectory from a short equilibration
run at three temperatures, pinned to specific time points, with the
trajectory file deposited next to the structure in data/.
The visualization itself — the cartoon → ribbon → wireframe arc — is what the chapter is about and what works. The numbers in the readout would just stop being illustrative ranges and start being measurements. The disclaimer at the top would stay exactly where it is, because the visualization is still a stylistic abstraction. The RMSD bar would have a citation. That would be the version of the chapter that an MD person could actually use to teach from.
For the v1 of the page, with no MD pipeline and a hackathon-shy operator, the illustrative-with-disclaimer version is the right version.
The chapter, two screens deep
Below the figure and its readout, the chapter has two more body paragraphs. The first introduces aldolase as a glycolytic enzyme and explains why a glycolytic enzyme is the right protagonist for the melting chapter. The second sketches what “denaturation” means chemically — loss of tertiary, then secondary, then primary structure, in that order, irreversibly past a temperature-dependent point — without claiming to simulate it.
The body copy is in plain English. It does not use the phrase “free energy.” It does not use the phrase “Gibbs.” It does not draw the melting curve as a sigmoid because every reader who has not seen a sigmoid in their life would read the sigmoid as a separate authoritative claim. The chapter is for a non-biologist, the same way the project is.
A reader who wants the chemistry can read the linked papers in the citation accordion under the figure. That accordion lists the papers cited in the body, the PDB metadata, the AlphaFold metadata (global pLDDT 92.50 — aldolase is structurally rigid, exactly the kind of protein that resists denaturation until a clear melting point), and the literature T_m source. None of those numbers move through the scroll. They are anchors.
What lands next
The next post (Beat 4) is the retrospective on the full ship: all eight chapters shipped today, what the page weight came out to, the page’s Lighthouse numbers, what got cut between the plan and the result.
The post after that (Beat 5) is the cross-product retro on the three Google products that made this page possible — Antigravity 2.0 as the agentic IDE, the DeepMind Science Skills bundle as the data layer, and Stitch as the design tool that made the visual system fast to iterate on.
The lab is at https://heat-protein-lab.pages.dev/. The repo is at HeatThreshold/heat-protein-lab. Scroll into Chapter 4 with the temperature strip pinned at the top of the viewport; it is the chapter most worth experiencing on the live page rather than reading about.