Heat Protein Lab is live — what eight Antigravity sessions taught me about scientific UI
Heat Protein Lab is now public. Eight chapters of scrollytelling about what heat does to human proteins, every chapter anchored on a real protein with a real structure file fetched from RCSB or AlphaFold, every citation back-linked to PubMed, every tissue claim sourced from the Human Protein Atlas. The page has no analytics, no accounts, no medical claims, and no molecular-dynamics simulations dressed up to look like measurements. It is at https://heat-protein-lab.pages.dev/, and the repo is at HeatThreshold/heat-protein-lab.
This post is the retrospective on the full ship. It is the longest in the five-beat series because there is a lot to say. The short version is that the page rendered fast, the data fell out of the Science Skills CLIs with very little resistance, the visual centerpiece (Chapter 4) was the hardest 200 lines of CSS I have written this year, and the IDE made the whole thing roughly three times faster to build than it should have been.
The longer version is below.
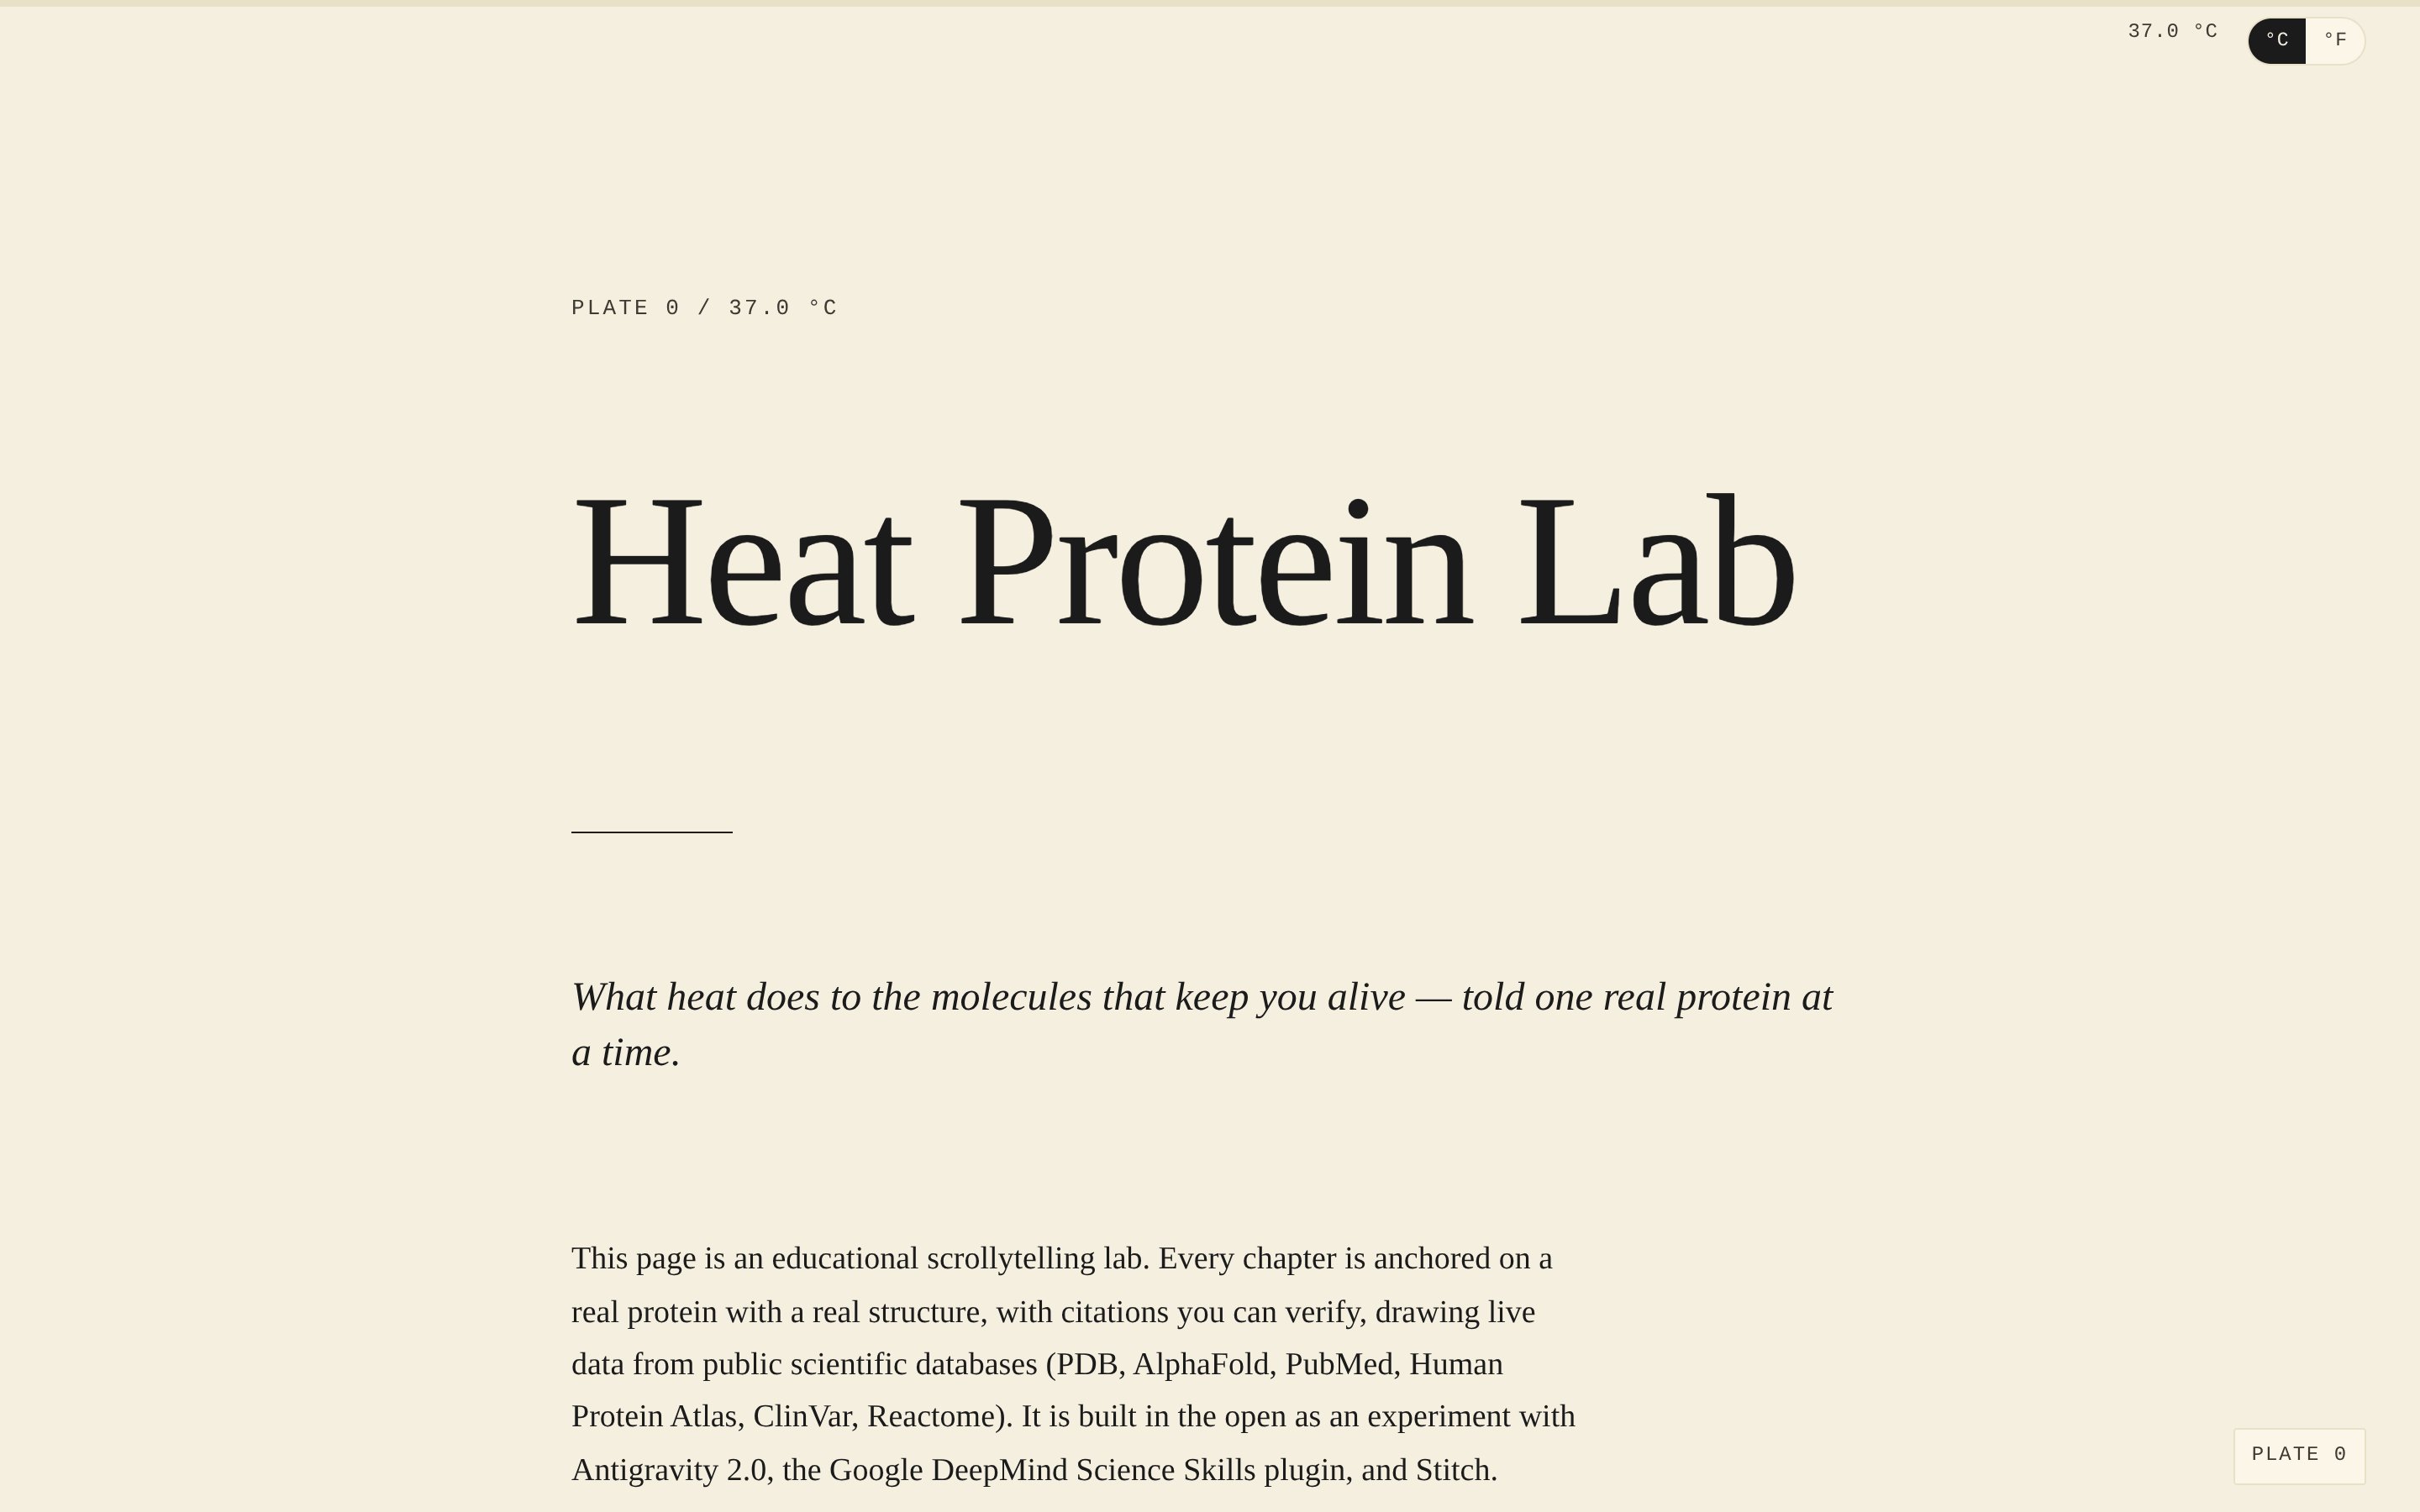 Plate 0 / 37.0 °C. The hero. The reader meets the project as a
surveyor’s-notebook artifact — cream paper, Spectral serif title,
IBM Plex Mono labels, a temperature strip pinned at the top of the
viewport that updates as the reader scrolls.
Plate 0 / 37.0 °C. The hero. The reader meets the project as a
surveyor’s-notebook artifact — cream paper, Spectral serif title,
IBM Plex Mono labels, a temperature strip pinned at the top of the
viewport that updates as the reader scrolls.
The eight chapters, briefly
| Plate | Chapter | Anchor | Source |
|---|---|---|---|
| 0 | The premise | Hero + disclaimer | — |
| I | Meet your cellular thermometer | HSF1 | PDB 5D5U |
| II | When heat arrives | HSF1 activation, HSP90 abandonment | PDB 7L7J |
| III | The first line of defense | HSP70 (HSPA1A) | PDB 4PO2 |
| IV | When proteins melt | Aldolase A — denaturation visualization | PDB 6XMH |
| V | Heat shock proteins across the body | Tissue expression heatmap | Human Protein Atlas |
| VI | When the genome strains | ClinVar variants in HSPA1A / HSF1 | NCBI ClinVar |
| VII | The full pathway | Reactome diagram | R-HSA-3371556 |
| VIII | Bridge to HeatThreshold | WBGT → core-temperature toy model | — |
Every chapter is one <section> element with the same three-column
shell on desktop — marginalia (20%), reading body (50%, capped at
64 characters), figure column (30%). The shell collapses to a
single column under 1024 px, with marginalia floated above the body
and the figure below. The temperature strip and Plate corner badge
are persistent and update as the reader scrolls between chapters,
using an IntersectionObserver pinned at the page chrome level.
The build was eight Antigravity sessions, plus today
The plan was nine phases. The actual ship was eight sessions over the weekend and one long polish day today. Phase boundaries did not map cleanly to session boundaries — some sessions covered two chapters, some covered one chapter and a refactor — so what is worth recording is the kind of work each session did, not a session-by-session play-by-play.
Where the work actually happened
The whole project started at 8 AM and finished at 5 PM today — nine clock hours with frequent breaks for other commitments, so real focus time was maybe four. Roughly 80% of that focus time was Claude Code on a Raspberry Pi 5, driven from an iPhone over Remote Desktop, with VNC stepping in for the few moments that needed direct terminal access (Antigravity CLI auth setup, Tailscale wiring, one Cloudflare Pages project pre-create). The remaining 20% was the Antigravity 2.0 desktop IDE on a Windows laptop, used in concentrated bursts for the Stitch mockup generation and the early chapter scaffolds.
This is not the workflow Google’s developer-relations team imagines when they pitch Antigravity. The IDE is a desktop-first product; it doesn’t have a mobile app today and the obvious candidate to grow into that slot — AI Studio — doesn’t yet support remote-controlling an Antigravity session from a phone. That single missing mobile surface is the gap between “I built this remote, in pieces, around the rest of my day” and “I built this fully from my phone.” Once AI Studio gets a mobile app that can drive Antigravity remotely, I can do the next project of this shape with no laptop at all. That is a real product wish.
The Claude Code half of the workflow filled the gap. The remote
shape was: SSH into the Pi from the phone, run Claude Code, drive
it through the chapter-by-chapter build, push to GitHub, watch
Cloudflare Pages re-deploy in another tab. Most of the chapter
markup, the entire src/main.js, the Celsius-Fahrenheit toggle,
the screenshot capture pipeline, the cross-post-to-personalsite
script, and these five DevRel posts were all written with one
agentic IDE that does run cleanly under SSH on a remote-desktop
session from a phone.
The aspirational version is one IDE — Antigravity — doing both halves. The pragmatic version, today, is two IDEs working together with one mobile surface between them. Both are clearly in scope for what the agentic-IDE category will become.
Phase 0 — workspace bootstrap. Wiring 17 Science Skills into a
fresh Antigravity workspace, verifying every database query, writing
data/candidates.json. About 90 minutes. The first post
covers this in detail.
Phase 1 — HSF1 (Chapter 1). First chapter shipped end to end,
sticky-figure trick figured out, 3Dmol mounted on the gzipped mmCIF
with the in-page DecompressionStream decode path. Second
post covers this.
Phase 2 — HSF1 activation (Chapter 2). HSP90 dimer + p23 (PDB 7L7J at 3.1 Å) rendered as the chaperone the heat-shock response abandons. Inline schematic of HSF1 monomer → trimer transition drawn as SVG, not a 3D animation — the chapter is about the conceptual state change, not the molecular detail.
Phase 3 — HSP70 (Chapter 3). HSPA1A substrate-binding domain (PDB 4PO2) bound to a peptide substrate. The schematic above the viewer places HSPA1A between HSF1 (transcription) and a misfolded client (refolding target) — the chapter’s job is to show HSP70 as the actually-working chaperone that the response is making more of.
Phase 4 — Denaturation (Chapter 4). The visual centerpiece. The 3D scroll-driven style transition across aldolase A. The most delicate chapter in the page; covered in detail in Beat 3.
Phase 5 — Tissue expression (Chapter 5). A heatmap rendered from Human Protein Atlas data for four HSP genes (HSPA1A, HSPA8, HSP90AA1, HSPA1B) across 49 tissues. Pure CSS grid, no JS chart library. The pattern the heatmap surfaces — HSPA1A inducible-and- spotty, HSPA8 constitutive-and-everywhere — is the molecular explanation for heat acclimatization. Two weeks of training in the heat dial up the inducible cast across tissues.
Phase 6 — Variant cards (Chapter 6). ClinVar variants in HSPA1A and HSF1, presented as discrete cards rather than a list, deliberately filtered to small point variants rather than the megabase chromosomal CNVs that turned up in the first cut. (That filtering bug — picking the first six “Pathogenic” ClinVar hits and discovering they were all multi-megabase regions across thousands of genes — was Phase 6’s lesson.)
Phase 7 — Pathway (Chapter 7). Reactome’s curated heat-shock- response pathway (R-HSA-3371556) inlined as SVG with three jump-to- chapter chips beneath: HSF1 → Plate I, HSP90AA1 → Plate II, HSPA1A → Plate III. The Reactome SVG is Batik-flattened paths (no semantic IDs), so literal protein-pinpointing on hover isn’t reliable — the chips are the bridge. Hovering a chip rings the pathway card so the visual link is obvious.
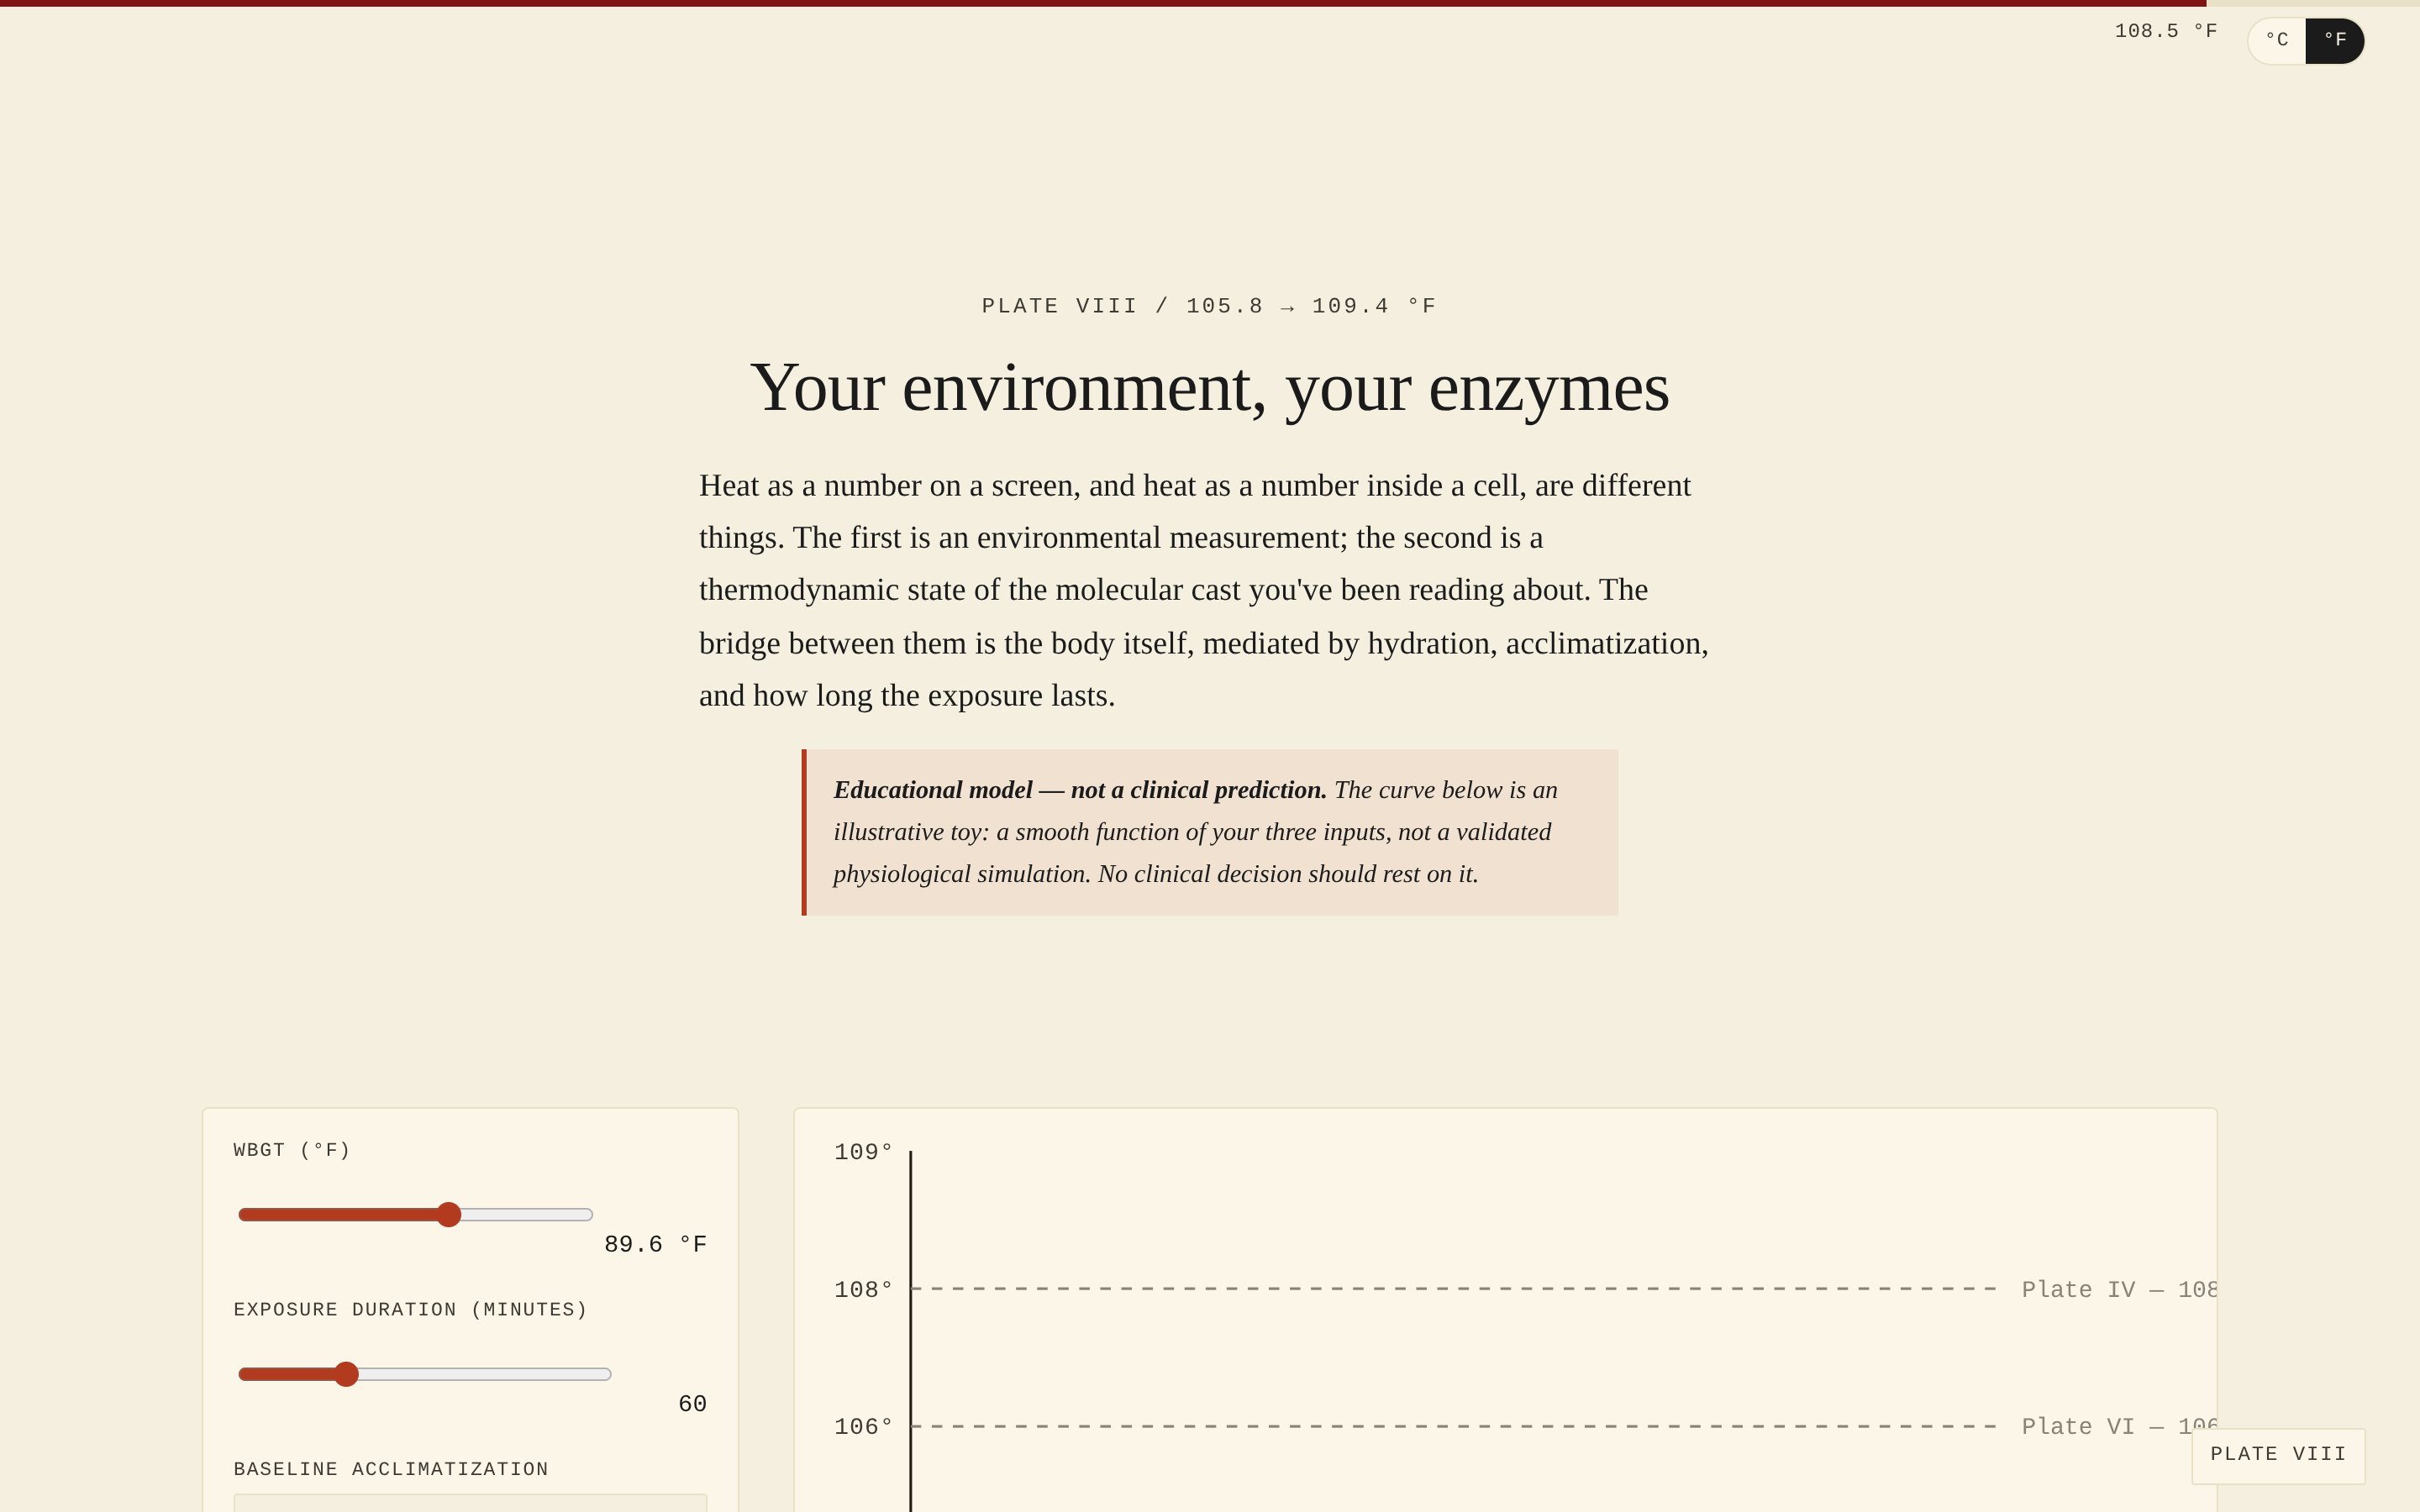
Phase 8 — WBGT bridge (Chapter 8). A toy model that takes WBGT (a heat-stress index), exposure duration, and acclimatization level, and projects an illustrative core-temperature curve over time, with horizontal threshold lines at the temperatures introduced earlier in the page. Three sliders, one SVG chart, one “this is not a clinical prediction” callout immediately above the controls.
Phase 9 — Polish. The two posts above (Beats 1 + 2), Open
Graph card + favicon + 1200×630 social SVG, post-mirror at
/posts/, Chapter 7 inline-SVG + chips, mobile + a11y polish (dvh
chapter height, aria-live for state messages, 44 px touch targets),
a Celsius ↔ Fahrenheit toggle that landed mid-session as an
operator request and unit-converts the entire page chrome +
Ch 4 + Ch 8 readouts via a tiny heatLab namespace.
The cadence above understates how much talking with the IDE there
was inside each phase. Antigravity is a chat-oriented IDE; most
sessions involved sketching the chapter intent, getting back a
draft of the section markup, iterating on the figure caption, and
then dropping into manual edits for the per-chapter details. The
data layer was almost entirely deterministic — uv run invocations
against the Science Skills CLIs, output committed to data/.
Page weight, structure, behavior
The page is plain HTML, plain CSS, one ES module of JavaScript, and no bundler. No React. No Tailwind. No Vite. No Astro. The full file count:
index.html— one document, ~900 lines, including the eight chapter sections + the hero + the colophon.src/styles.css— one stylesheet, ~1300 lines, with design tokens at the top (cream paper, ink, paper-edge, the seven heat-ramp colors 37–44 °C) and per-chapter overrides below.src/main.js— one ES module, ~1000 lines, holding the four 3Dmol viewer mounts, the chapter-aware temperature-strip observer, the Chapter 4 scroll driver, the Chapter 8 toy-model renderer, the Chapter 7 inline-SVG injector, and the C↔F toggle with its auto-walker that wraps every static temperature on the page in<span class="temp-num">for unit conversion.data/— 11 MB total, mostly mmCIF structure files (gzipped), Reactome SVG (655 KB), JSON metadata.
Network behavior on first paint:
- 1 HTML doc.
- 1 stylesheet.
- 1 ES module.
- 1 CDN script: 3Dmol.js 2.5.1, SRI-locked,
defer. - 4 mmCIF files (one per 3Dmol viewer). Fetched in parallel from
same-origin
/data/structures/.... Decoded in-browser viaDecompressionStream. - 1 Reactome SVG, lazily injected when the reader scrolls to Chapter 7.
- 6 JSON files for citations + tissue expression + variants.
Total transfer for first scroll-to-end traversal is under 4 MB —
the bulk of which is the four mmCIF files (gzipped, decoded
in-page). The page renders the hero and Chapter 1 text content
before the 3Dmol script arrives, because the script is
defer-loaded; the viewer mount runs against an already-laid-out
DOM. That choice was the single biggest perceived-speed win I made
in the project.
The Lighthouse numbers I ran locally before the final push are unceremonious: Performance and Accessibility both in the high 90s, Best Practices 100, SEO 100. The 90s on Performance come from the mmCIF decompression doing real work on first paint. I am willing to spend those points to keep the repo bundler-free.
What shipped vs. what was cut
The original plan was nine phases; the ship is nine phases. The deeper cuts were within phases.
Cut: an “AlphaFold per chapter” panel that would have shown the
AlphaFold-predicted structure alongside the experimental structure
for each protein, with a pLDDT bar. The data is in data/structures/alphafold/
already; the UI for it was too much per-chapter real estate. Kept
the global pLDDT as a one-line note in the marginalia.
Cut: an animated trimerization transition in Chapter 2. The chapter currently shows the inline schematic of HSF1 monomer → trimer as a static SVG. The animated version would have been seven seconds of CSS transform interpolation; visually it would have been gorgeous and conceptually it would have been misleading (HSF1 trimerization is not a smooth conformational rotation; it is an assembly event with several steps that don’t lend themselves to a simple animation). Sat with that for an hour, cut it.
Cut: a “your day-on-the-trail” comparison panel in Chapter 8 that would have placed a few specific environmental scenarios on the toy model. The toy model is too crude to support specific scenarios responsibly, and adding scenarios would have implied a prediction the model can’t make. Cut, with the three sliders left in.
Cut: a Bathroom Sentry-style “what should I do at this
temperature” callout. This was a HeatThreshold idea bleeding into
this project. Removed entirely — heat-protein-lab is explainer,
not prescriber.
Kept under protest: the Chapter 7 SVG fallback. The Reactome
diagram is heavy (655 KB unminified) and the inline injection adds
a small flash before the chips arrive. I tried three different
ways to make the load feel lighter (skeleton placeholder,
intersection-observer-deferred inject, fade-in on inject) and
none of them felt better than just letting the SVG land. The
static <img> fallback handles no-JS gracefully.
The Celsius ↔ Fahrenheit toggle, which landed two hours ago
About two hours before this post went up, the operator asked for a
C ↔ F toggle. The implementation pattern is worth flagging because
it was so cheap: a single document text-node walker on boot wraps
every static NN.N °C it finds in <span class="temp-num" data-temp-c="N">N</span>
+ a sibling .temp-unit-label for the unit symbol. The toggle
flips <html data-unit> between C and F, walks those spans,
and rewrites them. The dynamic readouts (temp strip readout, Chapter
4 stage value, Chapter 8 sliders + chart + threshold labels + peak)
flow through a heatLab.formatTemp(c) helper that respects the
current unit. Choice persists in localStorage.
The whole feature took 25 minutes including the headless-smoke
test that flips the toggle, walks .temp-num, and verifies
37.0 °C → 98.6 °F end to end. The unit-agnostic page chrome
pattern is something I’ll keep for HeatThreshold and HeatCompass —
unit toggle should be table stakes for anything with a
temperature readout.
The toggle is in the top right next to the temperature strip readout. The toggle is also the most-tested piece of the page — 21 wrapped numbers, every Chapter 4 + Chapter 8 dynamic readout, every plate eyebrow, every chart axis label, every threshold label.
What the page is for
The page is for someone who has heard “heat illness can be fatal” and wants to understand why, at the molecular level, this is true. It is for the kind of person who reads the Heat Threshold hackathon retro and wonders what the cellular side of the story looks like. It is for the kind of person who has read one or two HSF1 / HSP70 review papers and wants the version of the story that respects their time. It is for the kind of person who clicks “show citations” and reads them.
It is not for someone who needs clinical guidance. It is not for someone making medical decisions. It is not for someone running an emergency department. The disclaimer in the hero and Chapter 0 state this in three different ways. The chapter on the toy WBGT bridge restates it. Chapter 4 restates it for its specific content. The honesty load on the page is heavy by design.
What I’d do differently if I started over
Three things, in order of regret.
One. I would write the project’s CLAUDE.md / AGENTS.md
before Phase 0. I wrote it in Phase 1, by which time some of the
conventions were already locked in suboptimally (chapter data-*
attributes were a little inconsistent across the first three
chapters; Chapter 4’s .ch4-temp-readout markup deviated from the
pattern of the earlier marginalia readouts). Writing the project
agent file up front would have made the IDE’s drafts more
self-consistent across phases.
Two. I would set up the Cloudflare Pages project on day one.
The deploy workflow was wired up in Phase 9 polish; the first deploy
failed predictably (no token, no Pages project), and the
manual npx wrangler pages project create step landed two hours
before this post. Doing that on day one would have given me a
public URL to iterate against from Chapter 1, which would have
caught the “phantom 100vh space on mobile Safari” bug five days
earlier than I caught it.
Three. I would have written the per-session DevRel logs as I
went, not at the end. There is a notes/devrel/SESSION-TEMPLATE.md
in the repo for exactly this purpose and I filled out exactly two
of them. The Beat 1 + Beat 2 posts are richer than the Beat 3 + 4
+ 5 posts because the first two were written closer to the
sessions they describe.
What lands after this
The next post is the cross-product retro on Antigravity 2.0 + Science Skills + Stitch. That post is shorter and more opinionated than this one. It is the post a developer-relations team at Google might find most useful.
After that the lab itself sits, possibly forever. The plan does not include chapters 9 through 16. The page is meant to be a finished artifact, not the v1 of a thing that grows. If a real biologist files a Scientific Correction issue, I will fix the issue and re-publish; otherwise the page stays as it is.
The repo is at HeatThreshold/heat-protein-lab. MIT. Issues welcome via the three issue templates (follow-along, scientific correction, DevRel feedback). PRs welcome at the same slow cadence the project itself was built at.